Last Updated: 14 Jul 2020 Americans paint a picture with words…Japanese tell the story with pictures
Many of my Japanese clients tell me that they wish their American colleagues would think more visually. When Japanese are asked to explain something or present data, they tend to use shikakuteki shiko, visual means such as charts, diagrams, sketches, or graphs. However, when asked to elaborate on something, Americans tend to just use more words. If it’s oral, it means they may go on and on talking, and if it’s on paper that might mean a long string of paragraphs. This tends to be frustrating to Japanese — and also frustrating to Americans when they discover that their Japanese colleagues may not have absorbed everything they were saying.
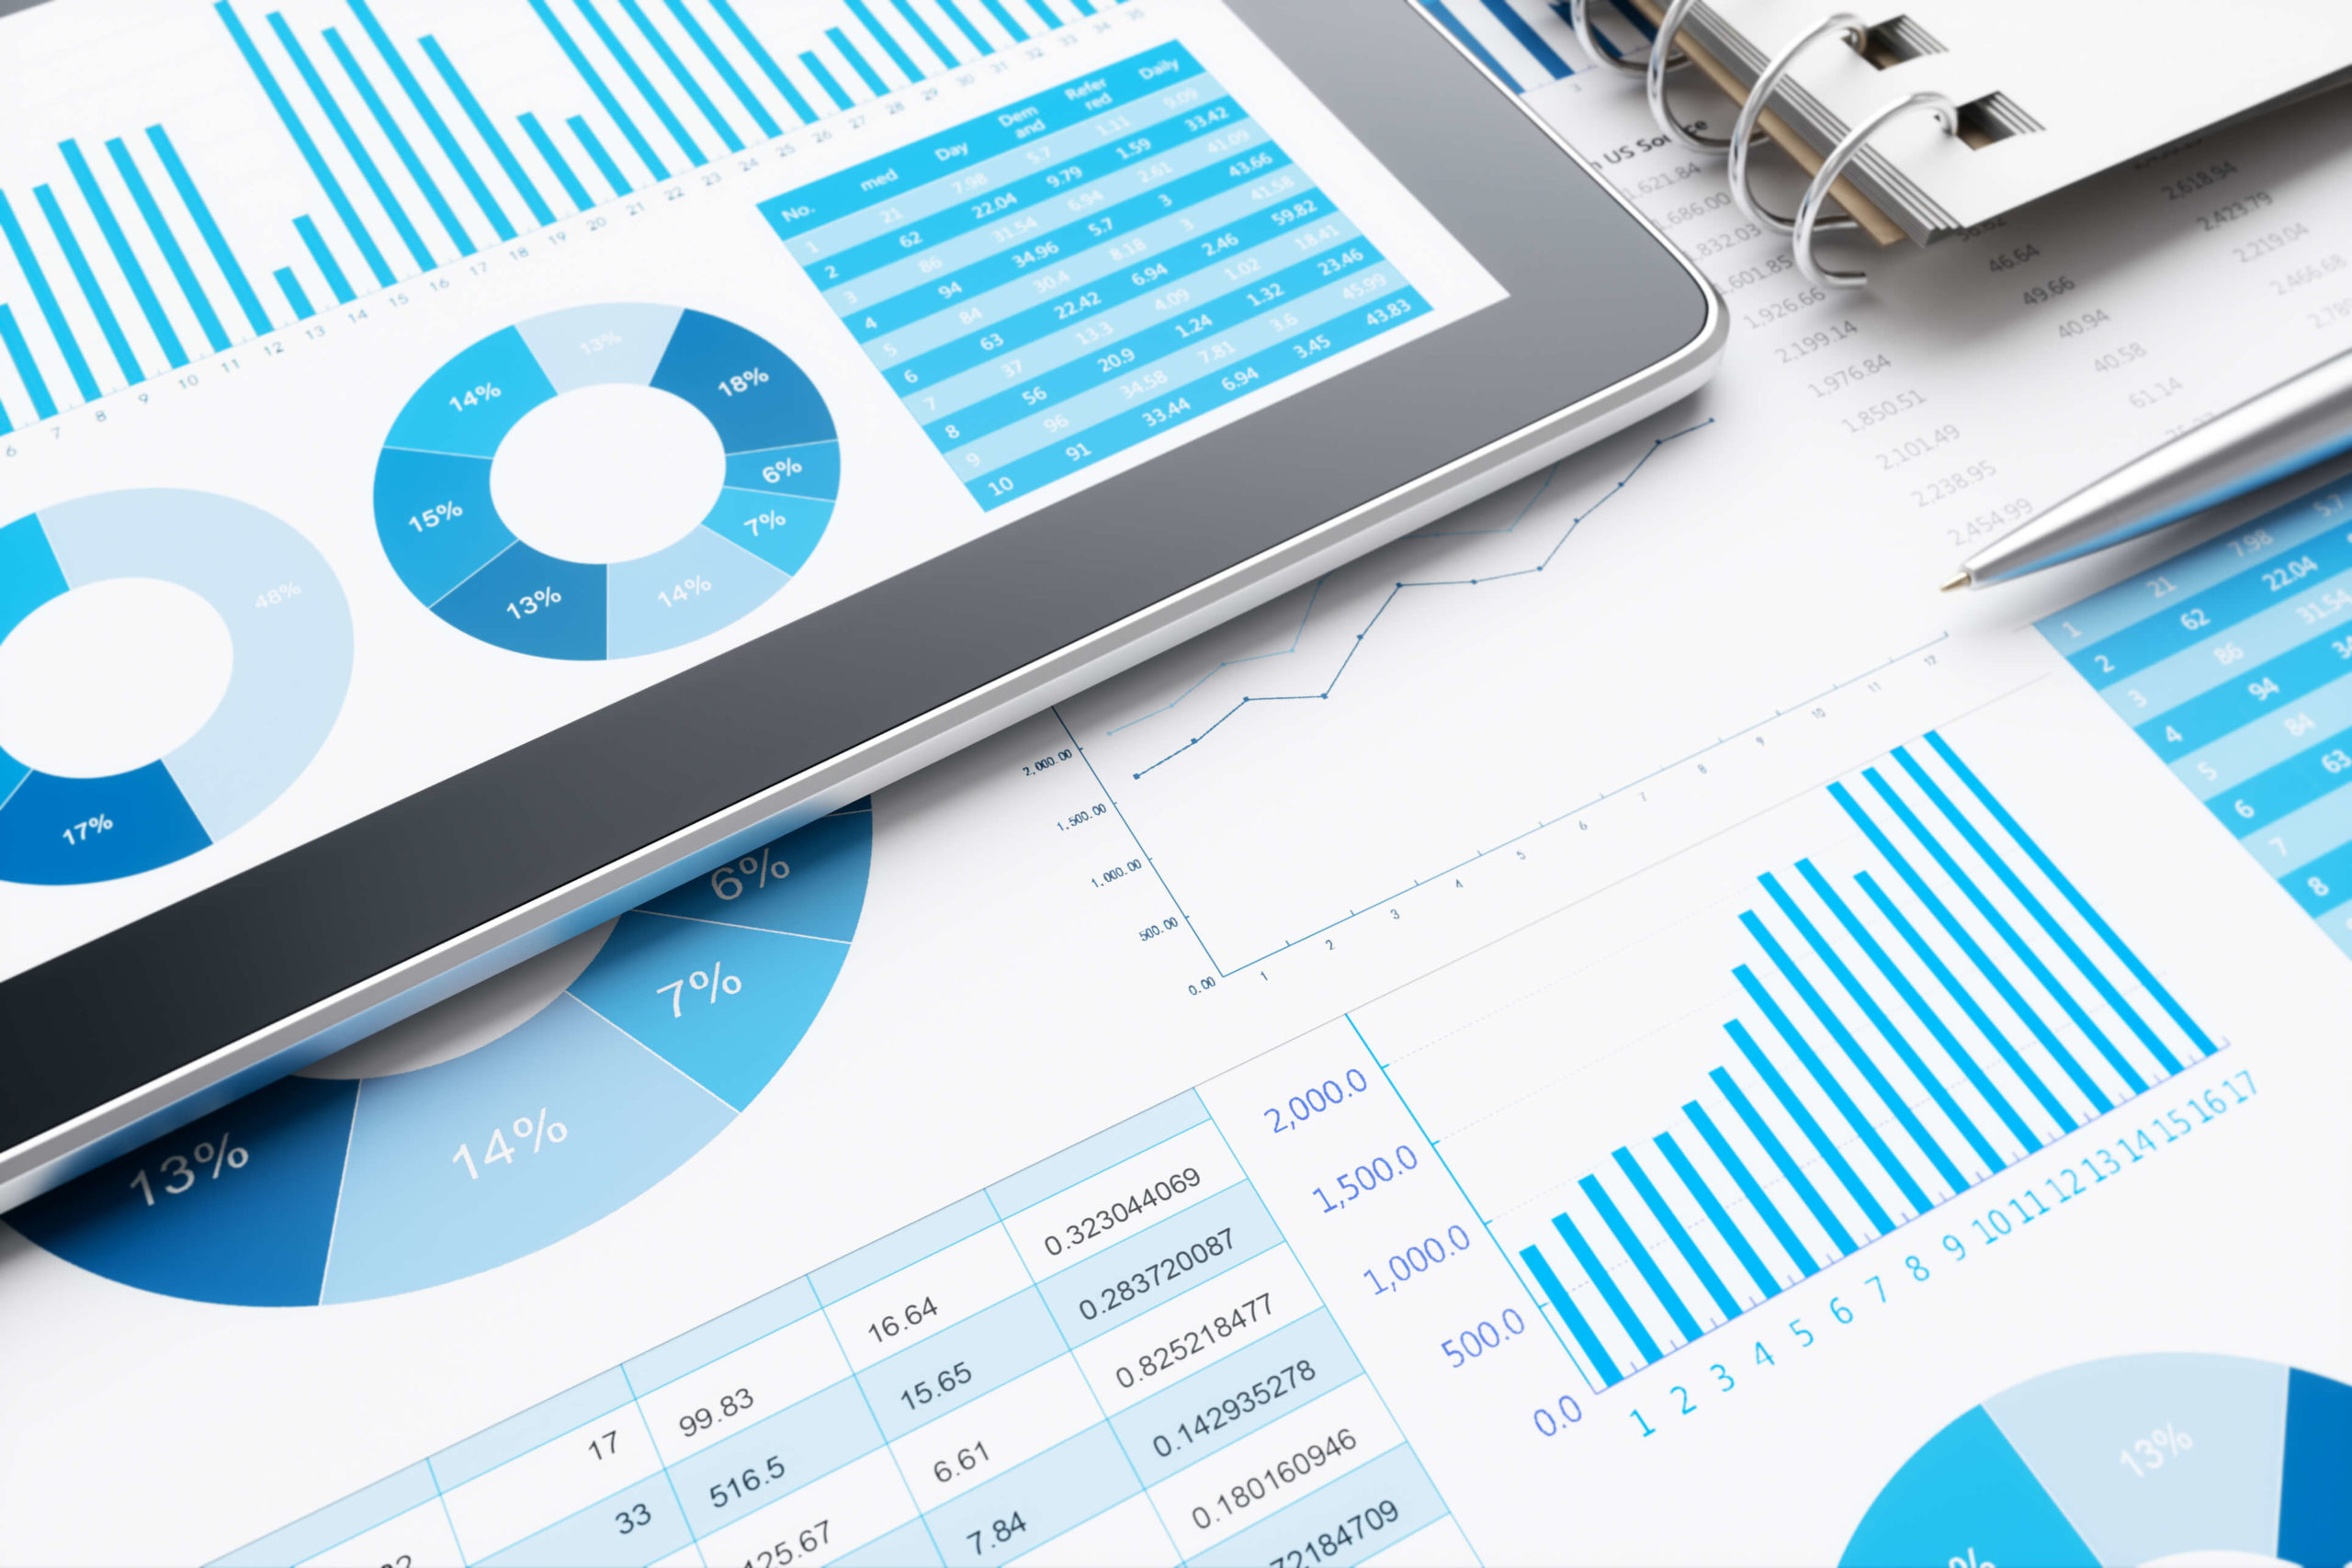
Given that the Japanese are masters of the presenting data visually (shikakuteki shiko), it’s not surprising that they would feel frustrated with colleagues who are not as adept in this area. To some degree, I think this is a matter of training – graphs and charts are featured prominently in the Japanese educational system and in Japanese business practice, much more so than in the U.S.
I also think there is a cultural element at work. It’s my observation that Japanese tend to prefer taking in information visually, while Americans tend to prefer taking in information aurally. My hypothesis is that this is due to the differences in the language — that the process of becoming literate in Japanese requires honing of visual processing skills beyond that required to become literate in English due to the ideographic characters.
The questions then arise, do Americans find the Japanese approach of using more visuals than words to be convincing? Or do they grudgingly accept the need to use more visuals for the sake of their business opportunities with Japanese?
The answer to both questions is “it depends.” Many Americans discover that using more graphics and visual thinking is more effective when working with Japanese. And being practical people, Americans like to do what works. I have heard some Americans tell me that they really appreciate the Japanese use of visuals, and feel that it’s very efficient and effective, and that it’s something they have learned a lot from. I have, however, heard some Americans who work at Japanese companies in the U.S. complain that their Japanese colleagues put too much emphasis on graphics. And that as a result, they are forced to spend lots of time creating various charts etc., and their careful verbal explanations are not listened to carefully. I once even heard one American at a Japanese firm complain that he thinks that the Japanese at his company give people more praise for being able to make pretty graphs than for coming up with good ideas or analysis. So indeed there may be some “grudging” feeling on the part of some Americans when asked to adopt a more visual Japanese style of communication.
Part of the issue I think is what is the most comfortable way for people to express themselves. I was educated in the typical American style with lots of emphasis on writing, plus on top of that I am a writer as part of my profession. So I find for myself that often I express myself best when I can put things down in words, and that often means long paragraphs. If the person I am communicating with is Japanese, I make an effort to then recast my output in a more graphic way, but the truth is that writing a lot of sentences is what comes most naturally for me. Not to mention that I am not as skilled with computer graphics programs as I might like to be. I think many Americans may share that same feeling.
As to whether Americans find the Japanese way of using more visuals to be convincing, again I think that depends on the person. (I also think it depends on who is making the visuals, as in my experience some Japanese businesspeople make wonderful graphics that skillfully capture a lot of information in a small space, and some Japanese make “pictures for the sake of pictures” that don’t really convey very much). That being said “a picture is worth a thousand words” is a longstanding concept in the U.S. And the recent trendiness of “infographics” and the recent popularity of books that describe how to use pictures and graphics to convey information are evidence that at least some people in the U.S. are starting to have more appreciation for a more visual style of communication.
This article originally appeared in Global Manager magazine
Other articles you may be interested in:
JAPANESE AND ENGLISH – BRIDGING THE LANGUAGE BARRIER
ARE AMERICANS BAD AT ORGANIZING DATA?
WHY JAPANESE LOVE CHARTS, GRAPHS, AND DIAGRAMS
Related articles
The culture component and why it matters in management
Let me start with what might at first appear to be a personal story unrelated to cross-cultural mana

Purpose should come from within, but also from outside Japan HQ
Recently an HR director for a Japanese financial services company in Europe told me that he had been

The different meanings of psychological safety in Japan, Europe and North America
The concept of “psychological safety” in the workplace started in the United States in the 1960s and